THE CHARACTERISTICS OF THOSE USING ROLLING FORECASTS
JUST 19% OF ORGANISATIONS LEVERAGE THE POWER OF ROLLING FORECASTS. WHY?
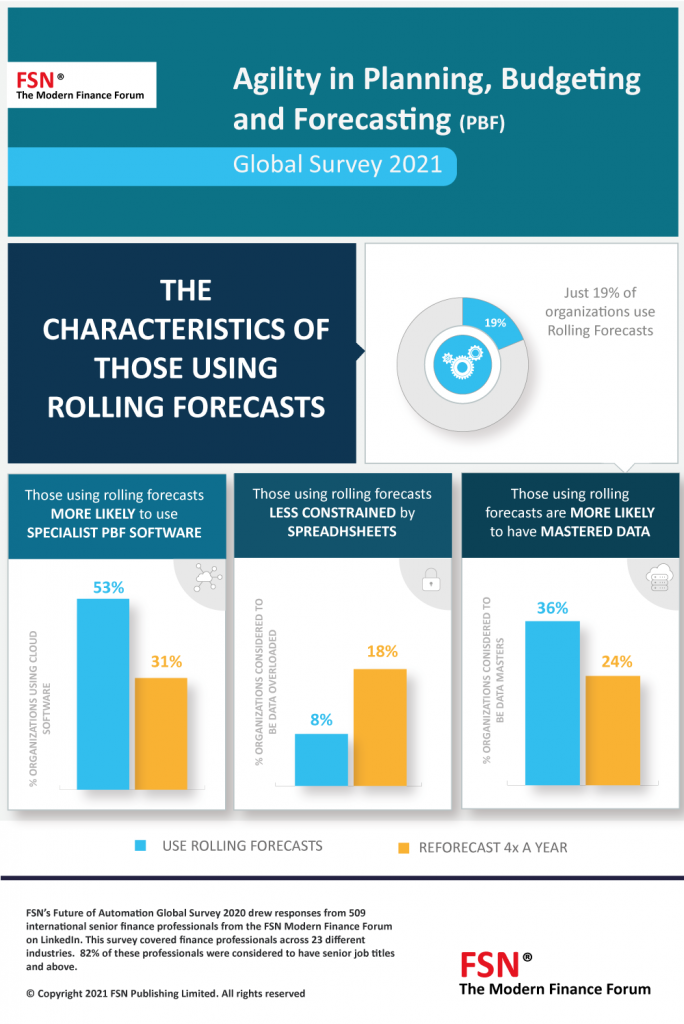
FSN’s research highlighted the crucial advantages of rolling forecasts over re-forecasting 4 times a year, yet only 19% of organisations leverage the agility they provide. The fourth graphic in the series of research infographics suggests why many businesses are falling behind.
In essence if you are spreadsheet-bound, have not mastered your data and are not using specialist software, then rolling forecasts are technically out of reach.
So, what is stopping you implementing rolling forecasts and how can you bring about the change?
The FSN Modern Finance Forum discusses this in depth here.
Wayne Slater shares his views, quoted below.
Quote taken from the LinkedIn Forum
“We find when organizations need to evolve to a more frequent mode of forecasting (rolling) vs static, this is quite often a major breaking point for manual spreadsheet planning. I think most finance professionals understand there are purpose-built planning tools like CPM out there, but there will be the natural uncertainty associated with pitching the solution internally, costs, deployment time, change management, and will the solution ultimately provide the results and ROI they are looking for.
Evaluate the available, cloud-based planning solutions and make sure they have vast experience in your market, with companies of your size, your ERP solution, a program for your success, a portfolio of relatable use cases, anticipated project timelines and results with you. Use this information to position it internally as solution to solve the forecasting challenge at hand, but also address your other FP&A challenges. Your selected vendor should be able to help you anticipate / and in the future demonstrate its ROI.”

Related Infographics in the Agility in Planning, Budgeting & Forecasting Series
HOW AGILE IS YOUR FORECASTING PROCESS? In this first infographic we explore how responsive or agile the PBF (Planning, Budgeting and Forecasting) process is to change against a series of FSN stress tests. The research finds that changing reports and reporting structures (hierarchies) remains a challenge.
HAVE WE SACRIFICED FP&A ACCURACY IN FAVOUR OF SPEED? The second infographic from our “Agility in Planning, Budgeting & Forecasting” research shows that forecast accuracy is getting worse – this despite many organisations forecasting more quickly.
WHICH IS BETTER? – ROLLING FORECASTS OR FORECASTING 4 TIMES A YEAR? The third infographic from our “Agility in Planning, Budgeting and Forecasting” research demonstrates that Rolling forecasts imbue PBF with agility.
THE CHARACTERISTICS OF THOSE USING ROLLING FORECASTS The research find that in essence if you are spreadsheet-bound, have not mastered your data and are not using specialist software, then rolling forecasts are technically out of reach.
Related Discussions in the Agility in Planning, Budgeting & Forecasting Series
HOW RESPONSIVE IS YOUR FORECASTING PROCESS? 60% of organizations can reforecast in under a week, yet just 40% are able to forecast with any real degree of accuracy and only 20% can forecast a year ahead with confidence. How come?
HAVE WE SACRIFICED FP&A ACCURACY IN FAVOUR OF SPEED? The second infographic from our “Agility in Planning, Budgeting & Forecasting” research in this forum shows that forecast accuracy is getting worse – this despite many organisations forecasting more quickly.
WHICH IS BETTER? – ROLLING FORECASTS OR FORECASTING 4 TIMES A YEAR? Are you considering rolling forecasts? If you use rolling forecasts, what has your experience been?
JUST 19% OF ORGANISATIONS LEVERAGE THE POWER OF ROLLING FORECASTS. WHY? So, what is stopping you implementing rolling forecasts and how can you bring about the change?
